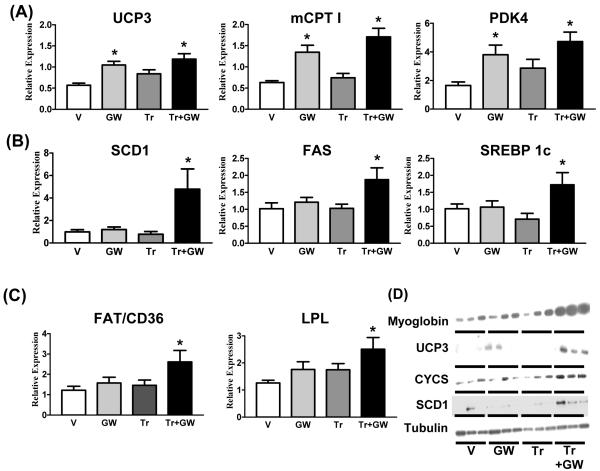
Figure 2. Gene and protein expression in quadriceps.
Relative gene expression levels of (A) FAO (Ucp3, Cpt 1b, Pdk4), (B) fatty acid storage (Scd1, Fasn, srebf1c) and (C) fatty acid uptake (Cd36, Lpl) biomarkers in quadriceps from V, GW, Tr and Tr+GW groups. Data is presented as mean±SEM (N=9) mice. * Indicates statistically significant difference between V and indicated groups (p<0.05, One Way ANOVA; post hoc: Dunnett’s Multiple Comparison Test). (D) Protein expression levels of oxidative biomarkers (myoglobin, UCP3, CYCS, SCD1) and loading control (tubulin) in quadriceps (N=3).

