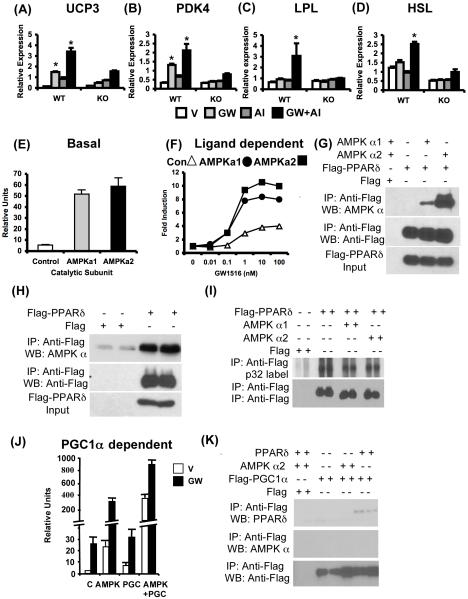
Figure 5. AMPK-PPARδ interaction.
(A-D) Expression of metabolic genes in wild type and PPARδ null primary muscle cells treated with V, GW, AI and GW+AI for 24 hr. In (E-F, J), AD293 cells were transfected with PPARδ+RXRα+Tk-PPRE along with control vector, AMPK α1, α2 and/or PGC1α as indicated. (E) Induction of basal PPARδ transcriptional activity by AMPK α1 or α2. (F) Dose-dependent induction of PPARδ transcriptional activity is enhanced by AMPKα1 (closed circle) or AMPK α2 (closed square) compared to control (open triangle). In (G-I, K), AD293 cells were transfected and processed as indicated. (G-H) Representative blot showing co-immunoprecipitation of transfected (G) or endogenous (H) AMPK with Flag-PPARδ. (I) Metabolic p32 labeling of PPARδ in AD293 cells transfected as described. (J) Synergistic regulation of basal (V) and ligand (GW) dependent PPARδ transcriptional activity by AMPK α2 subunit and PGC1α. (K) Co-immunoprecipitation of PPARδ but not AMPK α2 subunit with Flag-PGC1α. Data in (A)-(D) (n = 6), (E), and (J) (n = 3-4) are presented as mean ± SEM, and * indicates statistical significance (p < 0.05, one-way ANOVA; post hoc: Dunnett’s multiple comparison test).

