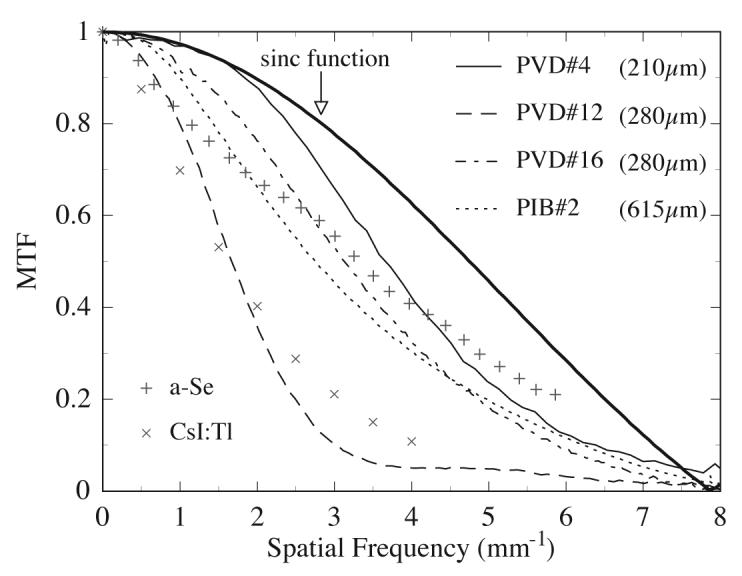
Figure 10.

Presampled MTF measured from four prototype arrays, PVD#4 (thin solid line), PVD#12 (dashed line), PVD#16 (dot-dashed line) and PIB#2 (dotted line). The graph also shows the sine function corresponding to the 127 μm pixel pitch of the arrays (thick solid line). The MTF of a direct detection AMFPI with a 1000 μm thick a-Se detector (plus symbols), along with the MTF for an indirect detection AMFPI with a CsI:Tl detector (cross symbols), are also shown. The a-Se and CsI:Tl results are based on reported MTFs, (Hunt et al 2004, Granfors et al 2003) modified so as to correspond to the results expected for 127 μm pitch arrays with signal collection fill factors of 100% and 80%, respectively.
