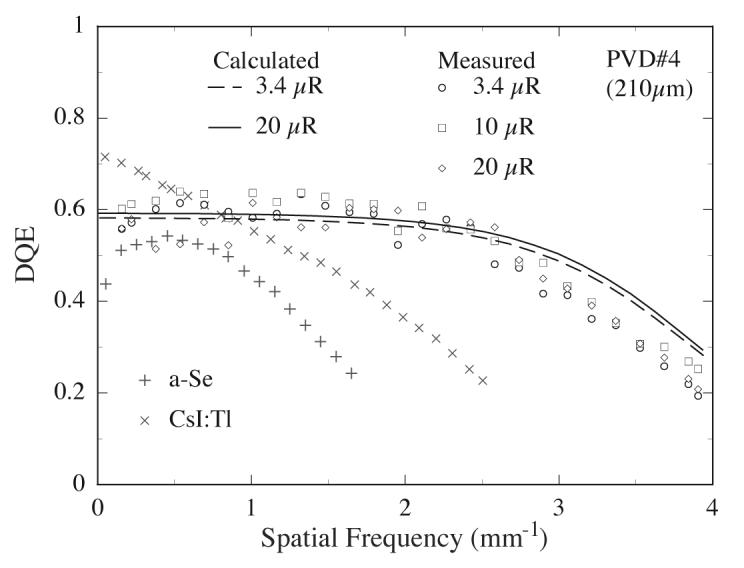
Figure 13.

Frequency-dependent DQE results for prototype PVD#4 at 3.4, 10 and 20 μR (circle, square and diamond symbols, respectively). These results correspond to DQE values determined experimentally using the NPS values reported in figure 12. For clarity of presentation, each plotted data point represents an average of the measured DQE over a frequency interval of ~0.16 lp/mm. The dashed and solid lines correspond to cascaded systems calculations of the DQE at 3.4 and 20 μR, respectively. Finally, the cross and plus symbols correspond to DQE values reported for a 300 and 200 μm pitch direct and indirect detection AMFPIs with a-Se and CsI:Tl detectors, measured with an x-ray spectrum similar to that used in the present study, at 4.4 and 3 μR, respectively. (Hunt et al 2004, Granfors et al 2003)
