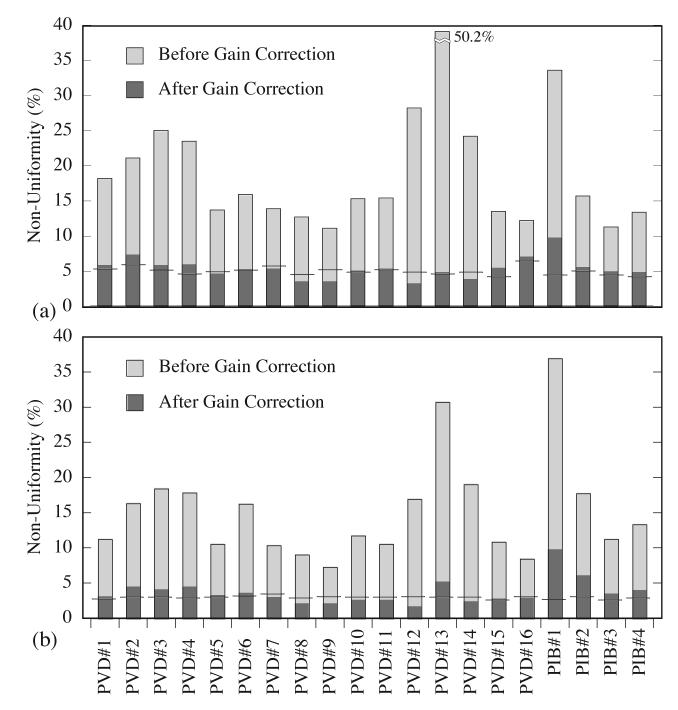
Figure 8.
Summary of the non-uniformity in x-ray signal response measured from a ROI of several thousand pixels for each prototype. Results are shown in the form of a bar chart for (a) the lowest exposures, ranging from 0.058 to 0.136 mR, and (b) the highest exposures, ranging from 0.206 to 0.380 mR. In each chart, for a given array, the non-uniformity before and after the application of a gain correction to the data is indicated by the top of the lighter and darker shaded portion of the bar, respectively. In addition, the non-uniformity to be expected, based only on considerations of the x-ray statistics of the image frame from which the data for this prototype was obtained, is indicated by a horizontal line across the corresponding bar.

