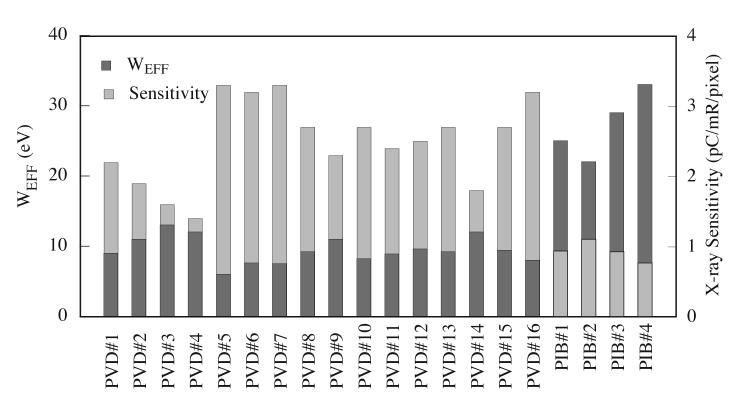
Figure 9.
Pixel x-ray signal sensitivity measured in radiographic mode and the corresponding WEFF obtained from blocks of hundreds tow-free regions of the prototypes, presented in the form of a bar chart. For a given array, the WEFF and the corresponding sensitivity are indicated by the top of the darker and lighter shaded portions of the bar, corresponding to the left and right scales, respectively.

