
Figure 4.
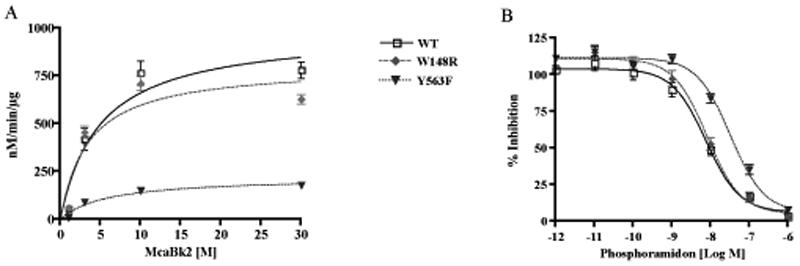
The initial rate of substrate hydrolysis and inhibition by phosphoramidon of wild type (WT) and mutated ECE-2s. (A) The initial rate of substrate hydrolysis (V0) at final concentrations of 0.1-30μM was determined by measuring the appearance of product under initial rate conditions. (V0) values were plotted as a function of substrate concentration ([S]) and fit to the Michaelis-Menten equation. Data represent the mean ±SEM (n=3). (B) Dose-dependent inhibition curve for phosphoramidon was generated by measuring the substrate hydrolysis in the presence of inhibitor at concentrations 1pM to 1µM. Data represent the mean±SEM (n=4).