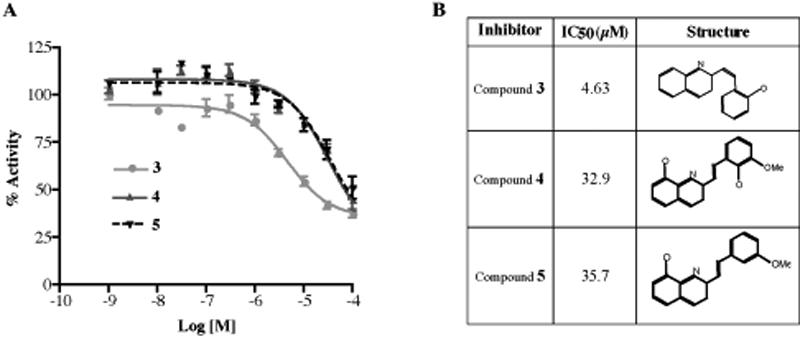
Figure 6.

Inhibition of ECE-2 activity by 1 analogs. (A) Concentration-dependent inhibition curves for three selected analogs, 3, 4 and 5 were generated by measuring the substrate hydrolysis in the presence of inhibitors at concentrations 1nM-100μM. (B) IC50 values for each selected inhibitor compound were determined by establishing concentration-dependent inhibition curves for a final McaBk2 concentration of 10μM. Data represent the mean±SEM (n=4).
