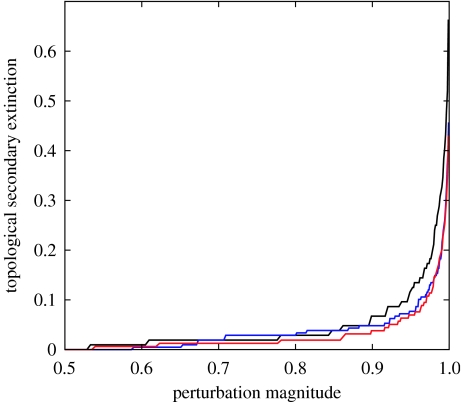
Figure 2.
Expected topological secondary extinction for Eodicynodon (black curve), Dicynodon (blue curve) and Lystrosaurus (red curve) assemblage zone communities. Perturbation magnitude (x-axis) is the proportion of primary production removed from the systems, and topological secondary extinction (y-axis) is the proportion of consumer species expected to go extinct as a result. Secondary extinction is summed over all guilds in the community.

