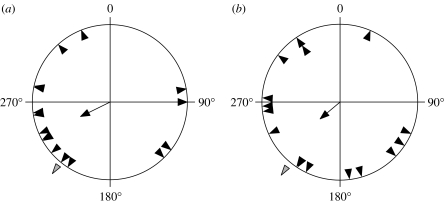
Figure 3.
Mean orientation directions of robins on night 9 (black triangles) for the (a) control and (b) experimental treatment, respectively. The arrow shows mean direction of orientation, and the length of the arrow represents concentration (r). The grey triangle represents the mean direction of Swedish robins during first autumn migration (220°, r=0.93, n=358; Fransson & Hall-Karlsson in press).

