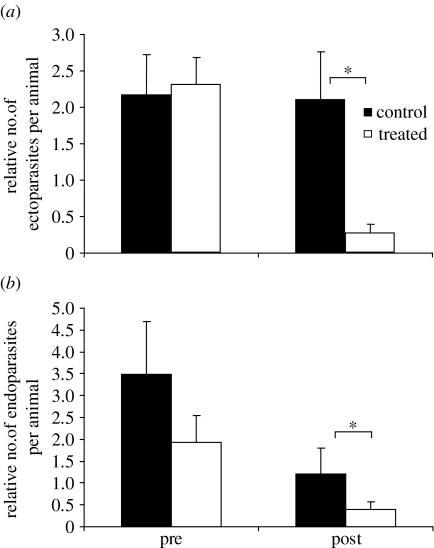
Figure 1.
(a) Relative number of ectoparasites per animal and (b) relative number of endoparasites per animal before treatment for parasites (pre) and after treatment (post). Filled bars denote control animals; open bars denote treated animals. Error bars denote standard errors. Asterisk indicates a significant difference between groups.

