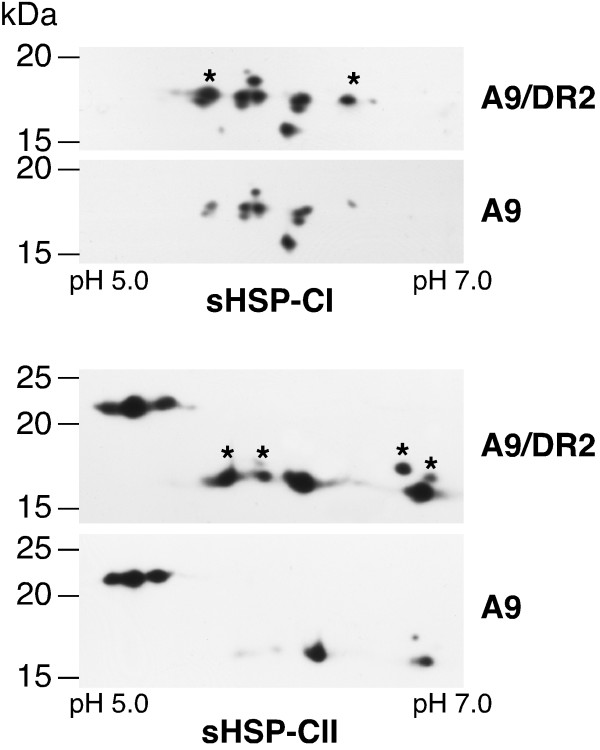
Figure 4.
Specific enhancement of the accumulation of some sHSPs in seeds of DS10:A9/DR2 lines. Comparison of the accumulation patterns of sHSP-CI and sHSP-CII. A representative, double-homozygous DS10:A9/DR2 line (A9/DR2) is compared to its sibling DS10:A9 line (A9). Asterisks mark the polypeptides that consistently showed higher accumulation in the DS10:A9/DR2 lines. Molecular mass markers (in kDa) are indicated on the left. The pH range for isoelectric focusing (IEF) is indicated (bottom).

