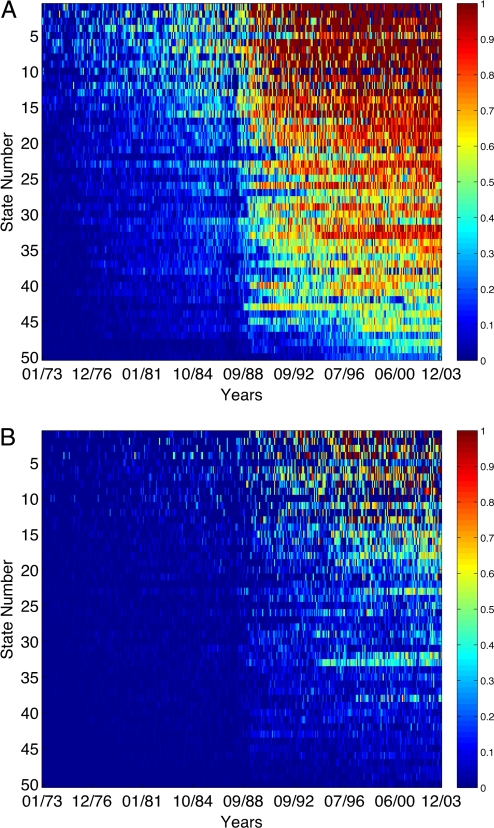
Fig. 2.
Prediction accuracies for DMF records with January 1973 to December 2003 birthdays across the 50 states. (A) Ratios of ANGNs (first 5 digits) accurately predicted. (B) Ratios of complete SSNs accurately predicted with <1,000 attempts. In each quadrant, columns represent months, and rows represent states (sorted by their 1973 births, lowest to highest). The colors in each cell represent ratios out of monthly SSN counts.

