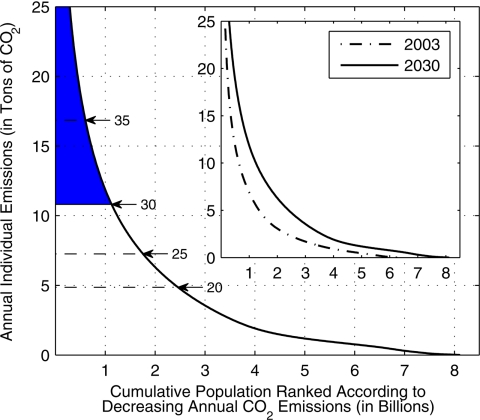
Fig. 2.
The world's population in 2030 (8.1 billion) ranked according to decreasing annual emissions. The total area under the curve is the projected BAU emissions in 2030 (43 GtCO2), and the blue region shows the 13 GtCO2 that needs to be removed to meet the 30 GtCO2 (“30” in figure) target. The individual emission cap is 10.8 tCO2, affecting 1.13 billion people. Also shown are the individual emission caps for global targets of 20 GtCO2 (cap at 4.9 tCO2), 25 GtCO2 (cap at 7.3 tCO2), and 35 GtCO2 (cap at 16.8 tCO2). The Inset contrasts the 2003 curve with the 2030 curve.

