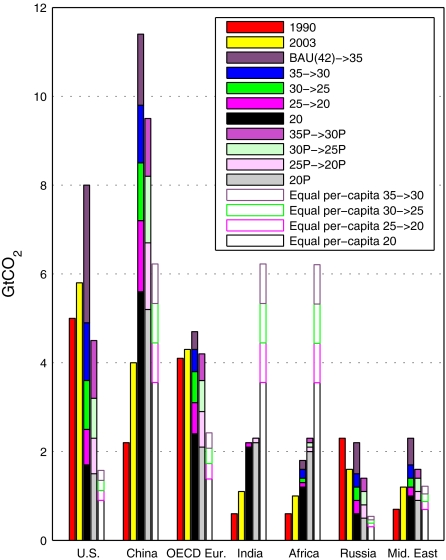
Fig. 7.
Emissions in 7 of the 16 EIA regions, in 1990, 2003, and for the global mitigation policies of 35, 30, 25, and 20 GtCO2 in 2030, both with and without poverty provision. The last bar on the right for each region indicates the targets corresponding to an equal per capita allocation scheme and the same 4 global mitigation targets. A table with data for all of the 16 regions can be found in the SI Appendix.

