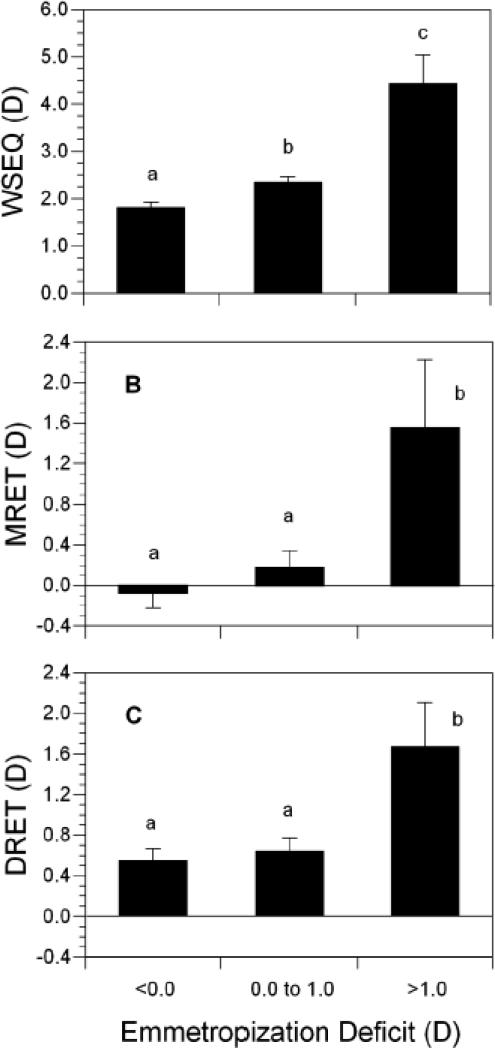
Figure 6.
Average values of WSEQ, MRET, and DRET at 3 months as a function of the “Emmetropization Deficit” (categorized residuals from the orthogonal regression in Figure 5). Bars with shared letters above are not significantly different. No shared letters indicates a significant difference. Error bars are the SEM.

