
Figure 3.
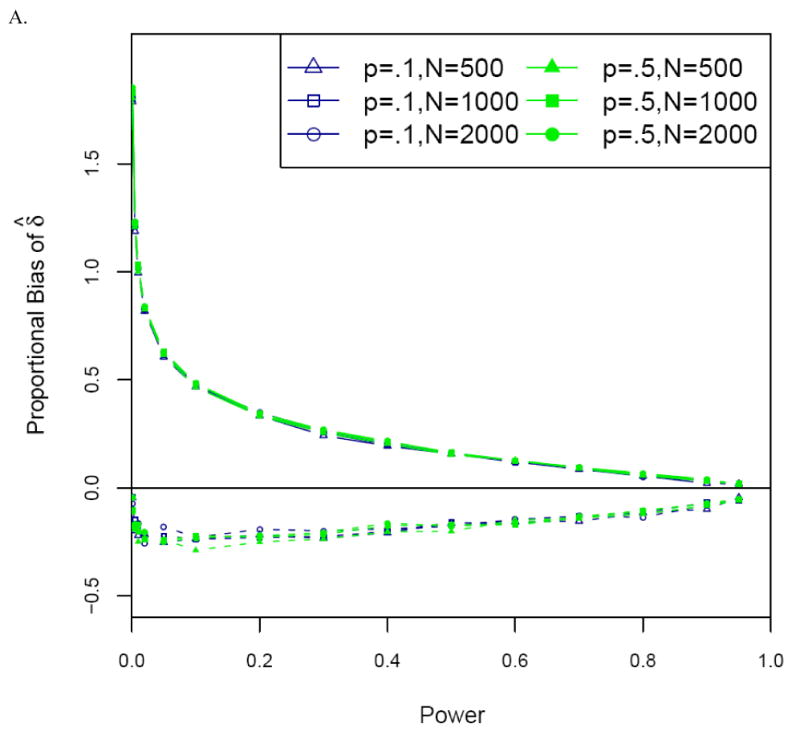
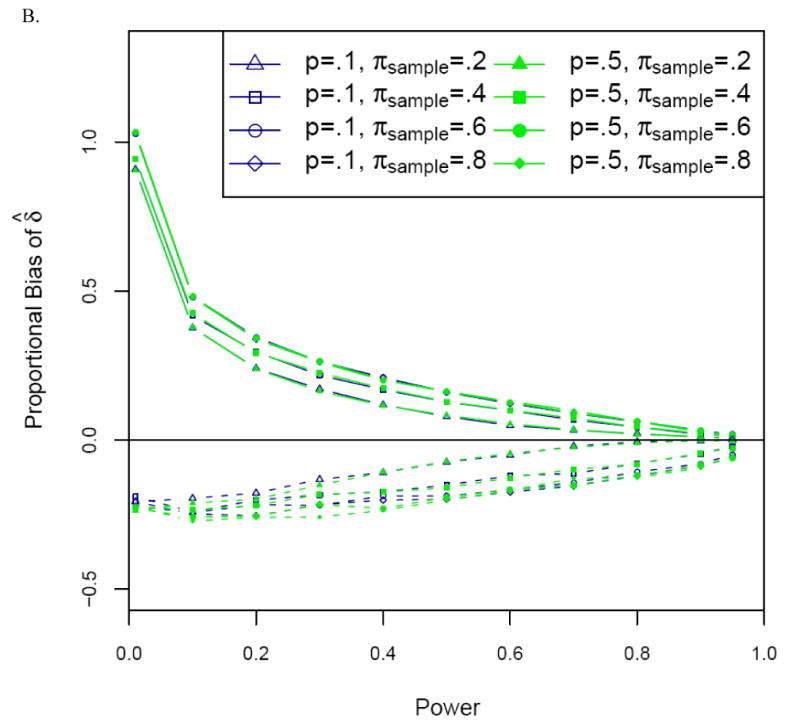
Proportional bias versus power for the uncorrected (naïve) (solid lines) and corrected (dashed lines) estimators of the allele frequency difference δ for (A) optimal and (B) non-optimal two-stage designs. Significance level α = 10-6. Designs optimal for multiplicative disease model with disease prevalence .10, stage 2 to stage 1 genotype cost ratio 30. For non-optimal designs, πmarker = 1%, and samples of N=1000 cases and N=1000 controls. Results are presented only for δ > 0.