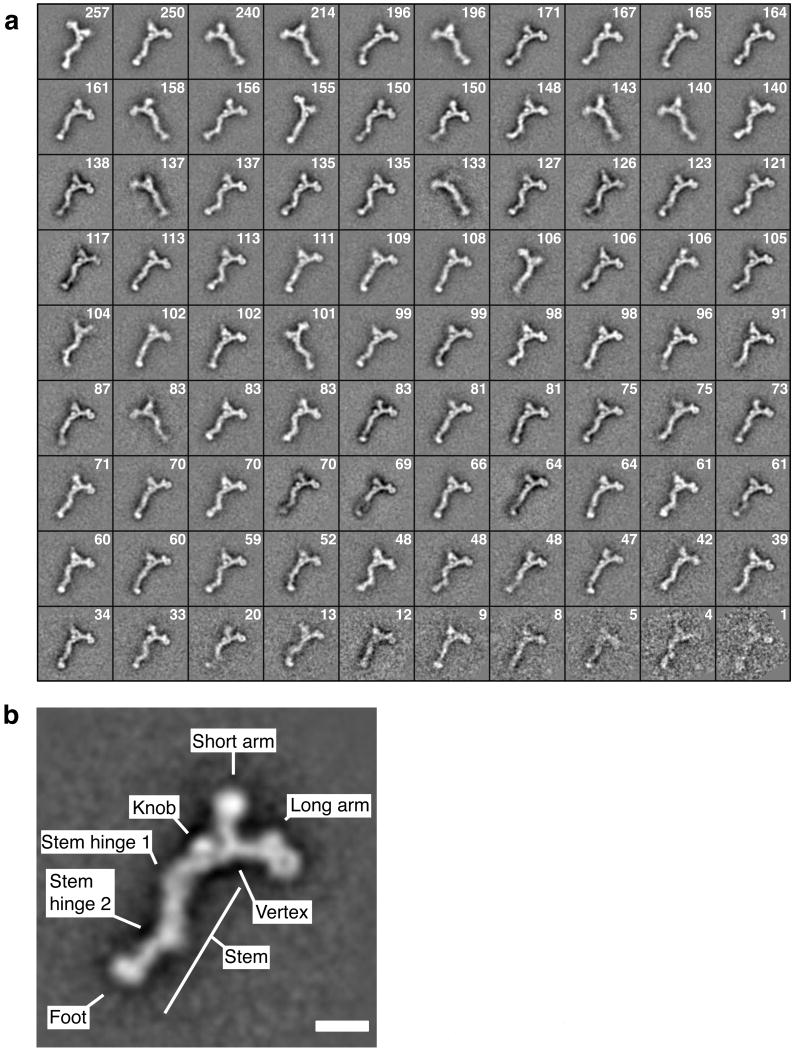
Figure 2.
Alignment, classification and averaging of particle images reveals structural details of the heptameric complex. (a) Reference-free alignment and k-means classification of 9,028 particle images into 90 classes resulted in the depicted class averages. The number of particles constituting each class is indicated. (b) A well-defined class average is shown and prominent features are named. Scale bar, 100 Å.

