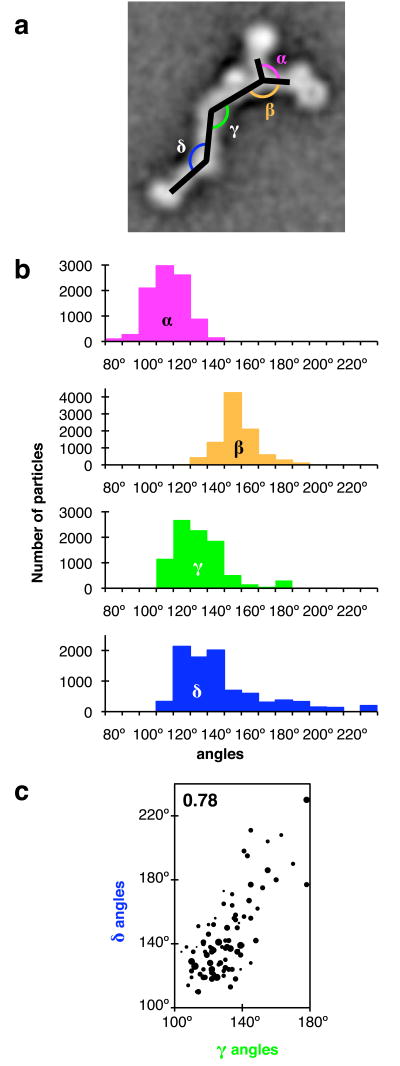
Figure 3.
Heterogeneity of particle appearance. (a) Definition of angles between particle segments for the two-dimensional view (2D) of particles. α, angle between long and short arms; β, angle between long arm and vertex-proximal stem segment; γ, angle at stem hinge 1; δ, angle at stem hinge 2. (b) Distribution of angles for the 90 classes shown in Figure 2. Angles were measured for 2D class averages and assigned to the number of particles constituting each class. (c) Correlation between γ and δ. Each marker indicates γ and δ for a particle class. Marker area is proportional to class size. Particle-based correlation coefficient: 0.78 (shown in purple); Class-based correlation coefficient: 0.72. All other combinations of angles α, β, γ and δ are plotted in Supplementary Figure 1; the corresponding correlation coefficients are between −0.44 and −0.0006.

