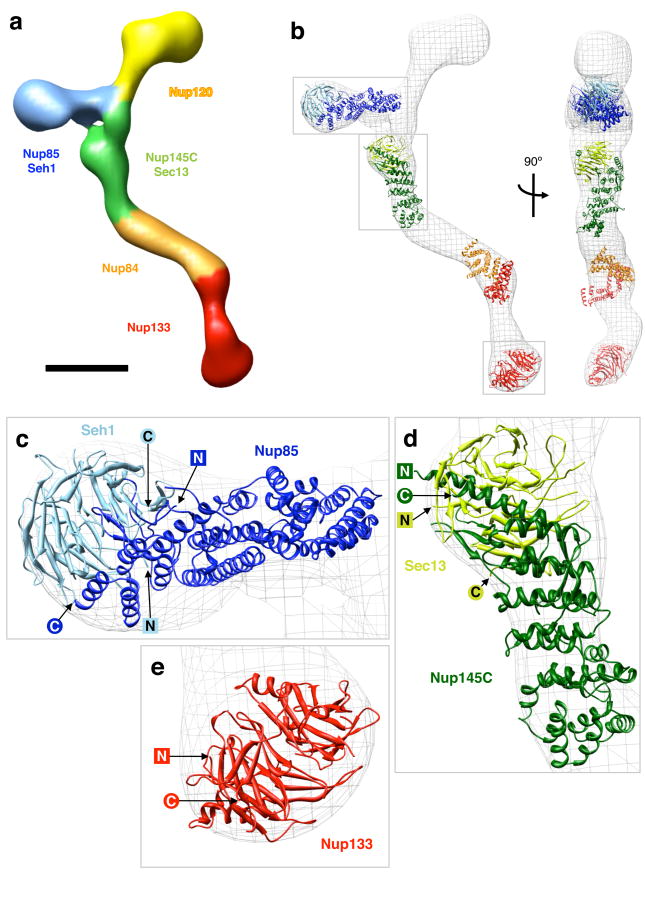
Figure 6.
Protein arrangement within the heptameric complex (a) Segmentation of the particle (map 2) based on mapped nup localizations and previously established biochemical interactions. The particle surface is color-coded to represent the regions of the particle corresponding to different modules. Boundaries between regions are approximate. Scale bar, 100 Å. (b) Docking of available crystal structures (ribbon representation) into map 2 (isodensity contour mesh representation). Two views related by a 90° rotation around a vertical axis are shown. The crystal structures are of: yeast Nup85 (amino acids 1-570 of 744, dark blue) in complex with yeast Seh1 (full length, light blue)6, yeast Nup145C (amino acids 125-555 of 711, dark green) in complex with human Sec13 (amino acids 1-316 of 322, light green)18, human Nup107 (the homologue of yeast Nup84, amino acids 658-925 of 925, orange) in complex with human Nup133 (amino acids 934-1156 of 1156, red)5, and Nup133 (amino acids 76-478 of 1156, red)30. The conformation of the Nup107·Nup133 fragment is likely to differ from the actual Nup84·Nup133 conformation in map 2, as evidenced by the poor fit, and the structure is included for illustrative purposes only. Empty regions in the particle map correspond to proteins and protein domains for which no crystal structure is available yet. Grey boxes indicate the regions of the map shown in the subsequent panels. (c-e) Detailed views of crystal structures docked into map 2; N and C termini of the crystallized nup domains are indicated.

