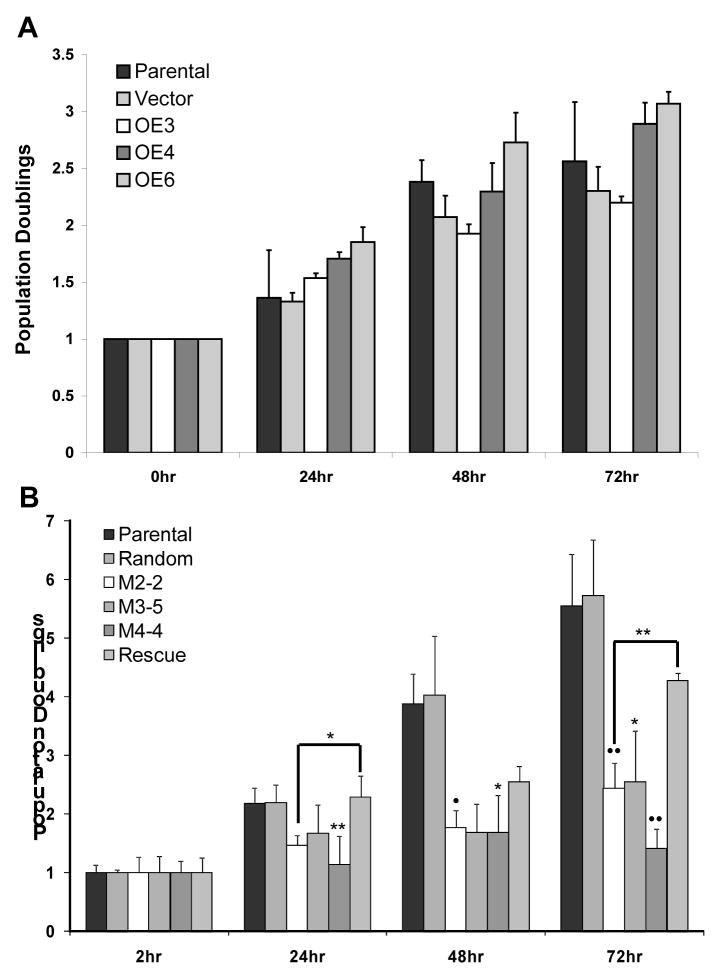
Figure 4. Cell proliferation is unchanged when Mustn1 is overexpressed but is reduced in silenced cells.
A.Cell proliferation measurements in Parental, Vector (control), OE3, OE4 and OE6 cell lines via MTS over a 3 day time course. There was no statistical significance between any cell line at any time point. B. Similar analysis of Parental, Random (control), silenced cell lines, M2-2, M3-5, M4-4 and Rescue. There was no statistical difference between Vector, Random, or Rescue and Parental cell lines at any time point. Each data point represents the average of triplicate MTS experiments (n=3). The value of each cell line was normalized to the 0hr time point to show population doublings. Error bars represent st. dev. All statistical significance was determined by ANOVA on ranks with Tukey post-hoc. Significant difference was only observed in between Parental and silenced cell lines, as well as M2-2 and Rescue. *p<.05, **p<.01, •p<.006, ••p<.001.

