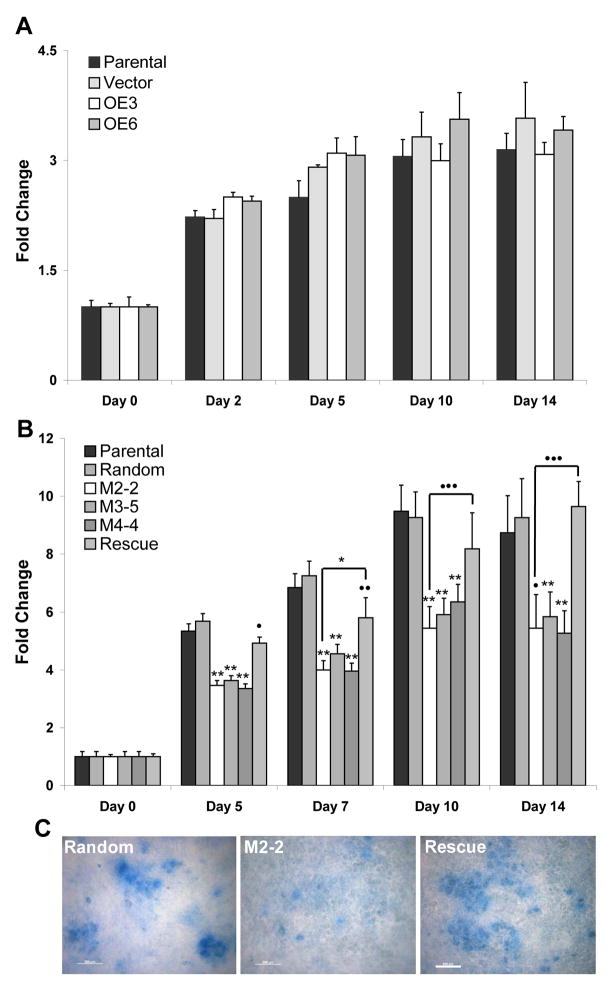
Figure 5. Matrix production is unaffected when Mustn1 is overexpressed, but is reduced in silenced cells.
Confluent cells from each line were stimulated to differentiate on Day 0. At specific times during differentiation all cell lines were fixed and stained with Alcian blue. The dye was then eluted and measured via spectrophotometry to quantitatively determine the amount of matrix produced at each time point. A. Parental, OE 3, OE6 and empty vector cell lines were assayed at Day 0, 2, 5, 10, and 14. B. Parental, Random, M2-2, M3-5, M4-4, and Rescue cell lines on Day 0, 5, 7, 10 and 14. C. Photomicrographs showing a random region from the respective Alcian stained cell line to indicate nodule formation and size (degree of differentiation). All bars indicate average of triplicate experiments ± st. dev. Significance was determined by ANOVA on ranks with a Tukey Post-hoc between the silenced cell lines vs. Parental levels or Mann-Whitney to compare M2-2 to Rescue. *p<.05, **p<.001, •p<.03, ••p<.02, •••p<.01.

