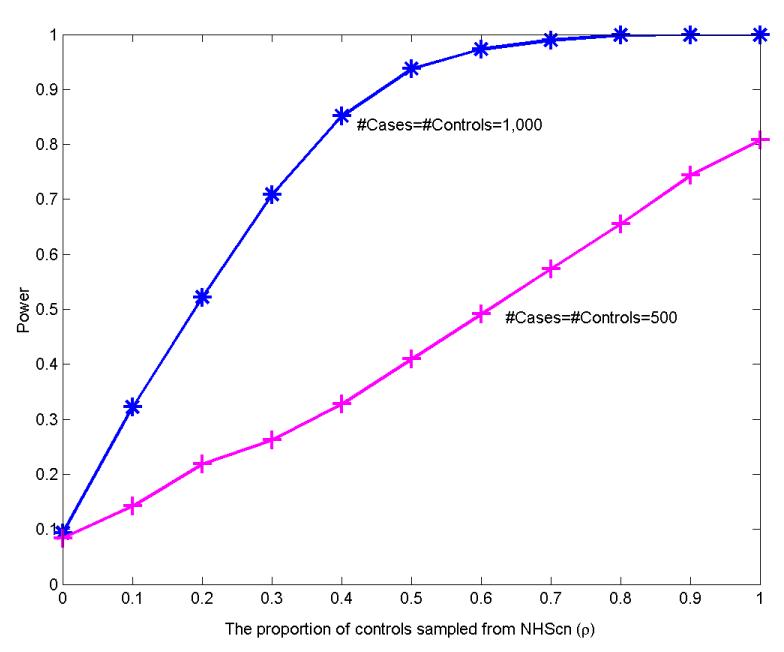
Fig. 1.
Power of the pseudo F test for detecting population stratification. Results are based on 1,000 replicates at the significance level 0.05. Within each dataset, the case group consists of a random sample of prostate cancer cases from the GWAS of prostate cancer; the control group is a mixture of two samples, one from the GWAS of prostate cancesr, the other from the GWAS of breast cancer cases.

