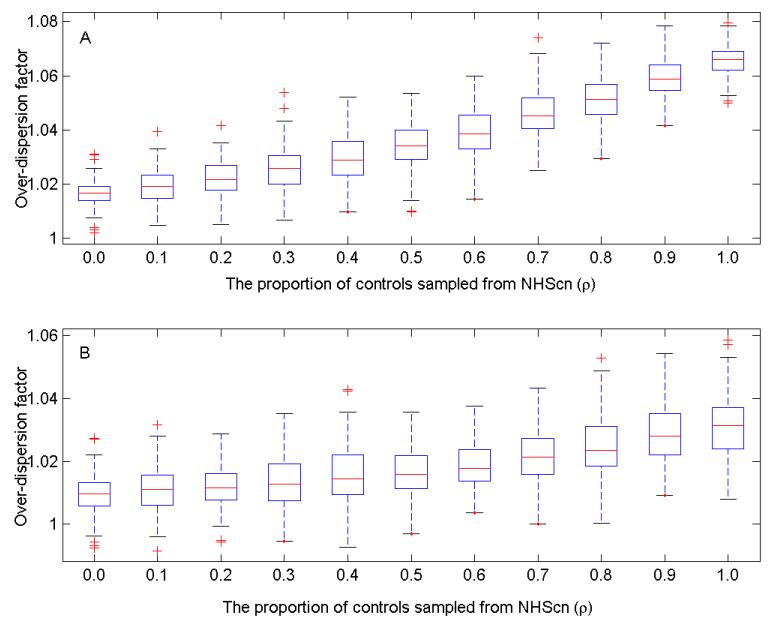
Fig. 2.
Boxplots of over-dispersion factor based on 100 replicates. Within each dataset, the case group consists of a random sample of prostate cancer cases from the GWAS of prostate cancer; the control group is a mixture of two samples, one from controls in GWAS of prostate cancer, the other from controls in GWAS of breast cancer. (A) Results under the sample size of 1,000 cases and 1,000 controls. (B) Results under the sample size of 500 cases and 500 controls.

