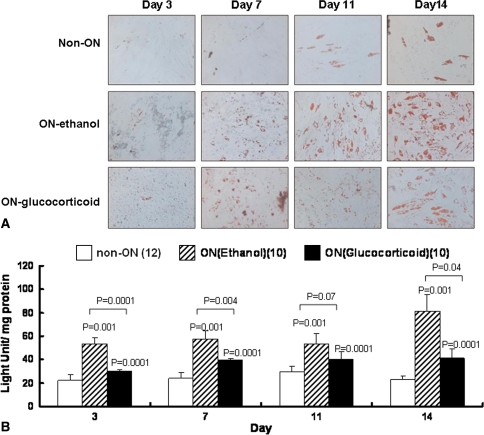
Fig. 4A–B.
(A) Photomicrographs (Stain, oil red O; original magnification, ×100) and (B) graphs show the adipogenic differentiation ability of isolated BMSCs. Cells were fixed and stained with oil red O stain at the third, seventh, eleventh, and fourteenth days. Adipogenesis appeared early on the third day in the ethanol-induced ON group, whereas it appeared on the seventh day in the glucocorticoid-induced ON group. The least and latest adipogenesis appeared in the non-ON group on the eleventh to fourteenth days.

