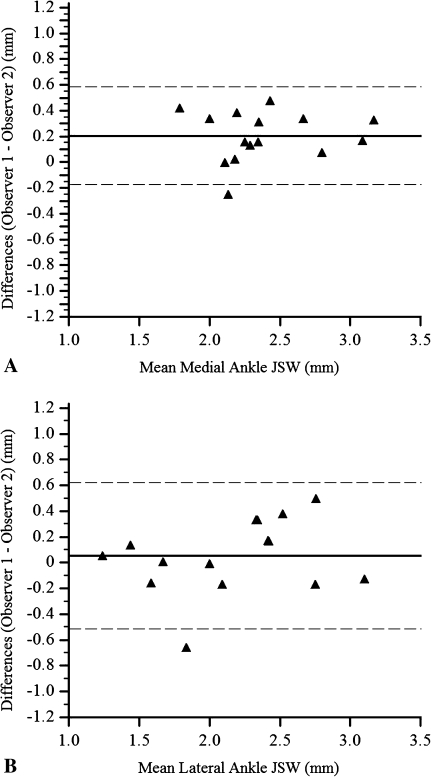
Fig. 3A–B.
Agreement between measurements by two observers for the narrowest (A) medial JSW and (B) lateral JSW of the ankle, using the method of Bland and Altman [2], is shown. Each graph illustrates the limits of agreement. The solid lines delineate the mean differences, and the dotted lines represent the mean difference ± 1.96 SD. The mean ± SD differences between the measurements were +0.21 ± 0.19 mm for the medial JSW and 0.05 ± 0.29 for the lateral JSW.

