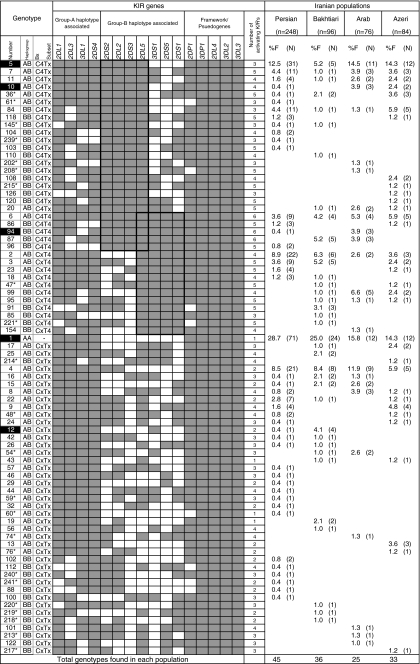
Fig. 3.
KIR gene content diversity of Iranian populations. Within 504 unrelated individuals representing four linguistic Iranian populations, 78 genotypes that differed by the presence (shaded box) and absence (white box) of 16 KIR genes were observed. The frequency of each genotype is presented in percentage frequency (%F) and defined as the number of individuals carrying the genotype (N) divided by the number of individuals studied (n) in the given population. Genotypes with identical gene content listed in this figure and in the Supplementary Figure 1a, b are marked with the same number. Unique genotypes that were not reported from other ethnic populations are identified by asterisk. Based on the gene content, genotypes were grouped as we described in the text. The genotypes that significantly differed (p < 0.05) among Iranian populations are marked by dark boxes: genotypes 1 (Persian vs. Arab, p = 0.035, Persian vs. Azeri, p = 0.013), 5 (Bakhtiari vs. Azeri, p = 0.044), 10 (Persian vs. Arab, p = 0.041), 12 (Persian vs. Bakhtiari, p = 0.041), 94 (Persian vs. Arab, p = 0.041)

