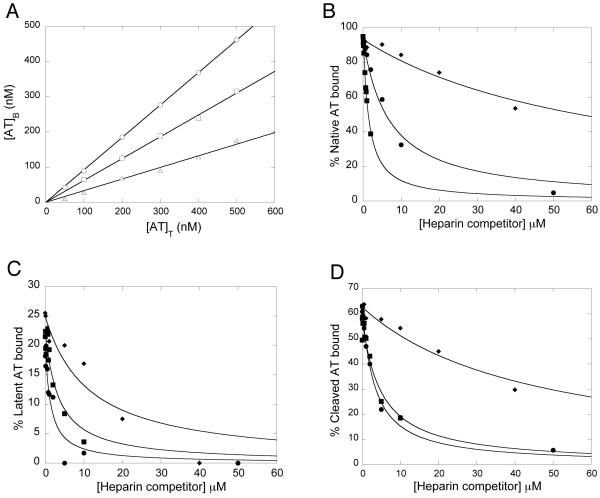
Fig. 4. Binding of native, latent and cleaved antithrombin to a heparin matrix in the absence or presence of heparin competitors.
Binding was first studied as a function of increasing total antithrombin concentrations in the absence of heparin competitors (A). The displacement of antithrombin by increasing amounts of heparin competitors was then analysed for native (B), latent (C) and cleaved (D) antithrombin forms. The solid line in (A) represents linear regression fitting. The solid lines in (B-C) represent nonlinear regression fitting to Eq. 1, as described in Experimental Procedures. ○, native antithrombin; □, cleaved antithrombin; △, latent antithrombin; ◆, LAH; ■, HAH; ●, normal pentasaccharide.

