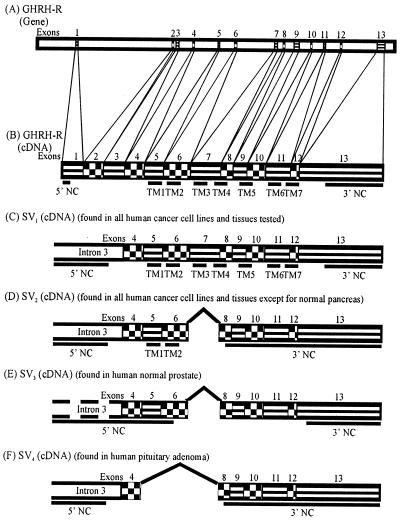
Figure 2.
Schematic drawing of exon–intron structure of the GHRH-R gene (A); and cDNA structures of the full-length pituitary GHRH-R (B), GHRH-R SV1 (C), SV2 (D), SV3 (E), and SV4 (F). The thick underlines indicate the 5′ and 3′ noncoding regions (NC) as well as the transmembrane domains (TM). The blank areas connecting the underlines represent the other receptor protein domains. Designations similar to those of Gaylinn et al. (35) are used with additional data (¶, 34).

