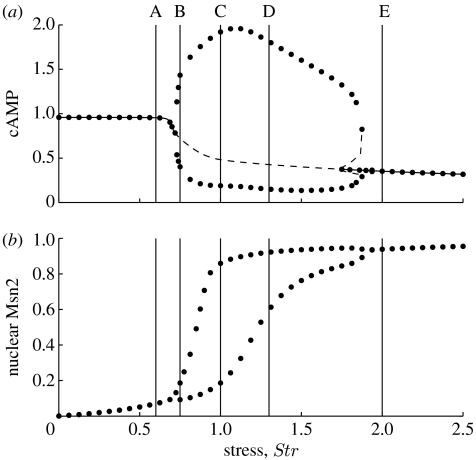
Figure 2.
Bifurcation diagram showing the envelope of oscillations for (a) cAMP and (b) nuclear Msn2 as a function of stress intensity (Str) in the deterministic model (Garmendia-Torres et al. 2007). Parameter values are given in table 1. The values of Str marked A–E correspond to the five situations considered in figure 7. Dots representing data obtained by numerical integration of equations (2.1a)–(2.1g) and (2.3a)–(2.3d) correspond to stable periodic or steady-state behaviour. In (a), dashed lines obtained with the program Auto (Doedel 1981) correspond to unstable periodic or steady-state behaviour.

