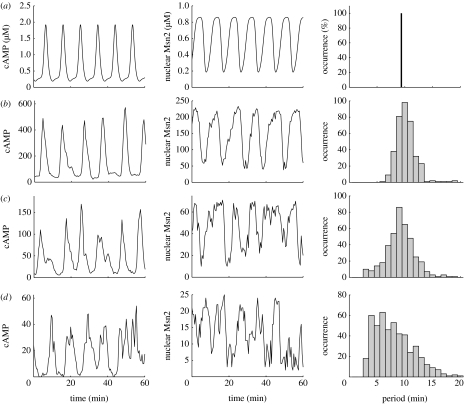
Figure 5.
Effect of molecular noise on the oscillations of cAMP and Msn2. Oscillations in cAMP and in nuclear Msn2 are shown in the left and centre columns. The right column shows the histogram of periods determined for oscillations of nuclear Msn2 over 4×10³ min. In the stochastic simulations, the number of molecules is varied by changing parameter Ω. (a) Deterministic oscillations are compared with stochastic oscillations obtained for (b) Ω=250, (c) 75 and (d) 25. Noise progressively overcomes the oscillations as Ω decreases to a value of the order of 25. Other parameter values are the same as given in the legend to table 1. The periods, or, rather, the time intervals between successive peaks, were determined by computing the time difference between two successive passages of nuclear Msn2 through the value 0.5 upwards. To filter out fluctuations around that threshold, periods smaller than (arbitrarily) 2 min were discarded.

