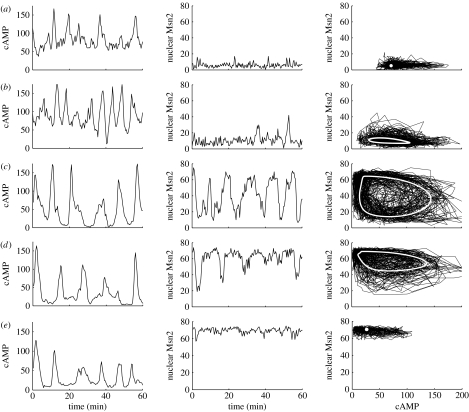
Figure 7.
The effect of stress intensity on the stochastic oscillations of cAMP and Msn2. The curves show the oscillations in cAMP (left column) and in nuclear Msn2 (centre column) obtained in the stochastic model for increasing values of stress intensity indicated by the corresponding vertical lines in the diagrams in figure 2: (a) Str=0.6, (b) 0.75, (c) 1, (d) 1.3 and (e) 2. Other parameter values are the same as given in the legend to table 1. The phase plane trajectory associated with the noisy oscillations is shown in the right column. The white points or curves indicate (a,e) the stable steady state or (b–d) the limit cycle trajectory predicted by the deterministic model. The deterministic results were obtained by integration of equations (2.1a)–(2.3d) for the parameter values listed in table 1.

