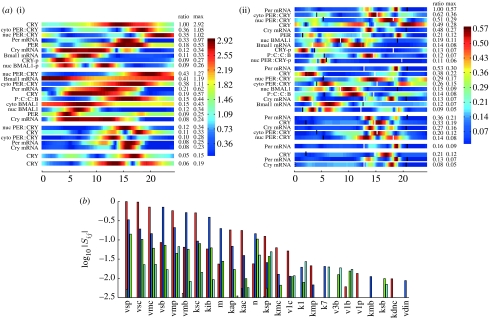
Figure 3.
(a) The SHMs for the model of the mammalian circadian clock discussed in figure 2: (i) fi,m and (ii) . The threshold for the fi,m is set to be 5% of the global maximum of the fi,m(t). For the (t) heat map, the corresponding threshold is 7.5%. These were chosen to keep the figure size small and smaller thresholds can be used. The only values of i (the sensitivity PC index) and m (the variable index) for which maxt fi,m(t) or (t) is greater than this threshold have i=1, 2, 3, 4 or 5. Each block of variables corresponds to one value of i. Thus, in (i), the first block of nine variables corresponds to i=1. The plotted fi,m are coloured on the scale shown after scaling each of them by a factor 1/ai,m to make all their amplitudes the same as that with maximum amplitude. These factors ai,m are in the column marked ratio. (b) The PSS where each group of bars corresponds to the value of log10 |Sij| for a particular parameter kj. These are only plotted for those i for which |Sij| is significant (in this case i=1–4). They are coloured as follows: red (pc 1), i=1; blue (pc 2), i=2; green (pc 3), i=3; light blue (pc 4), i=4. The parameters kj are ordered by maxi=1–4|Sij| and only the 25 most sensitive are plotted. To demonstrate how the heat maps can be used, we consider the sensitivity of the 32 phases of the maxima and minima of the various products. We see from table 1 of the electronic supplementary material that the control coefficient of such a phase for xm(t) is proportional to a linear sum of the , and we therefore need to check whether the phases of the maxima or minima are hot times for the . We have therefore plotted the maxima and minima on the heat map (black, minima; white, maxima). We immediately see that some of the maxima are sensitive, notably Per mRNA and cytoplasmic PER–CRY complexes that are the most sensitive. Following these, approximately one-third as sensitive are nuclear PER–CRY complexes, Cry mRNA and CRY protein. Of the minima, only those of cytoplasmic PER–CRY complexes and CRY protein appear to be significantly sensitive. Using the software described in the electronic supplementary material, one can quickly turn this into quantitative information. For the most sensitive phases ϕ, the high values of occur when i=1. Therefore, to see what parameters these most sensitive phases are sensitive to, we check the red bars in the PSS in the second row of the figure, since these are the values of log10 |S1j|. We quickly see that four parameters dominate (vsp, vsc, vmp and kib) and three others have a sensitivity a little above 10% of the maximum. Only 12 out of the 56 parameters have more than 1% of the maximum sensitivity for these phases.

