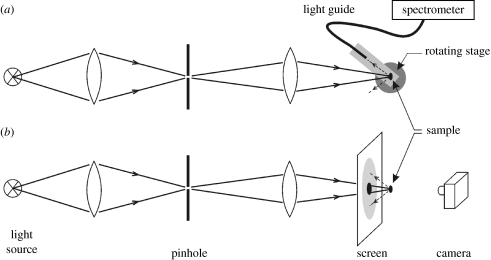
Figure 4.
Diagram of an optical system for measuring the angular distribution of the light scattering from a sample. Light from a light source is focused on a pinhole, which is imaged on the sample. (a) The light scattered by the sample is collected at a range of polar angles by a light guide mounted on a rotating stage and delivered to a spectrometer. (b) A white screen with a small hole placed in between the imaging lens and the scale allows visualization of the spatial distribution of the light reflected by the butterfly scale; this may also be done in transmission (modified from Giraldo et al. 2008).

