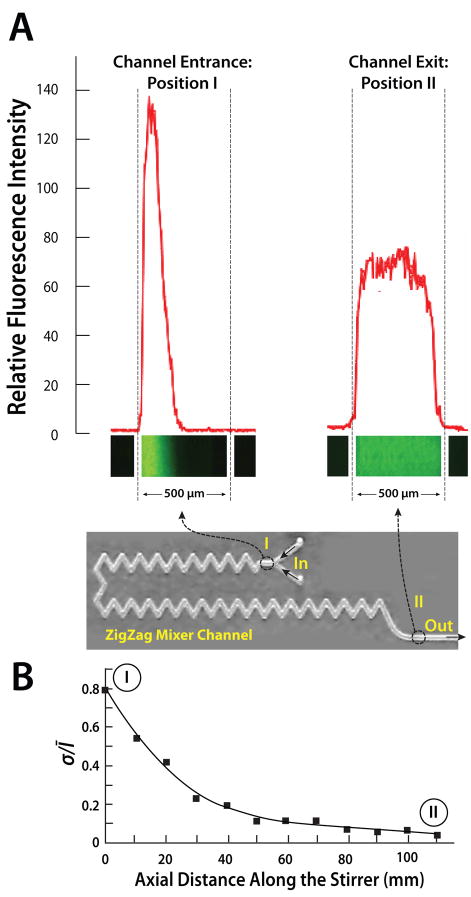
Fig. 5.
A photograph of the zigzag mixer in the cassette combined with images of the fluorescent intensities at the stirrer’s inlet (I) and exit (II) as a function of the conduit’s width (A). The fluorescent images were captured with a CCD camera. The Reynolds number of the flow (based on the hydraulic diameter) is 5. (B) The standard deviation of the fluorescence intensity, normalized with the average intensity, is depicted as a function of the conduit’s length.

