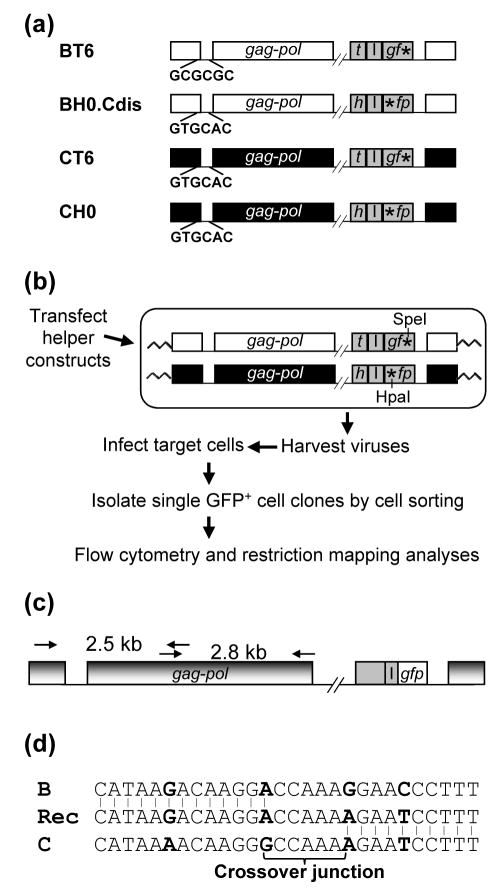
Figure 1.
System used to study the crossover junctions of HIV-1 recombinants. (a) Schematic structures of the HIV-1 vectors used to study intersubtype HIV-1 recombination. Subtype B and C proviruses are shown in white and black, respectively; reporter genes are shown in gray. h, hsa; t, thy; I, IRES; *, inactivating mutation in gfp. The DIS sequences of each vector are shown. Sequences between pol and the reporter genes are not shown (indicated by the double slash lines). All of the HIV-1 vectors also contained functional tat and rev. (b) Experimental approach for the generation of HIV-1 intersubtype recombinants. The restriction enzyme sites of the two gfp mutations are shown. (c) PCR amplification of GFP+ recombinant provirus. PCR primers that annealed to both HIV-1 subtype B and C proviruses were used to amplify a 2.5-kb and a 2.8-kb PCR product (from nt 113 to 2593, and from nt 2329 to 5095, respectively; NL4-3 nucleotide number designation). PCR products were sequenced directly. (d) Identification of the crossover junctions. A representative crossover junction is shown; Rec, recombinant. Nucleotides used as markers to identified crossover junctions are shown in boldface. The 5′ region of the recombinant sequence was derived from subtype B, whereas the 3′ region was derived from subtype C. Recombination occurred in the 5-nt region in the middle (crossover junction). All identified crossover junctions have two or more markers flanking each end.

