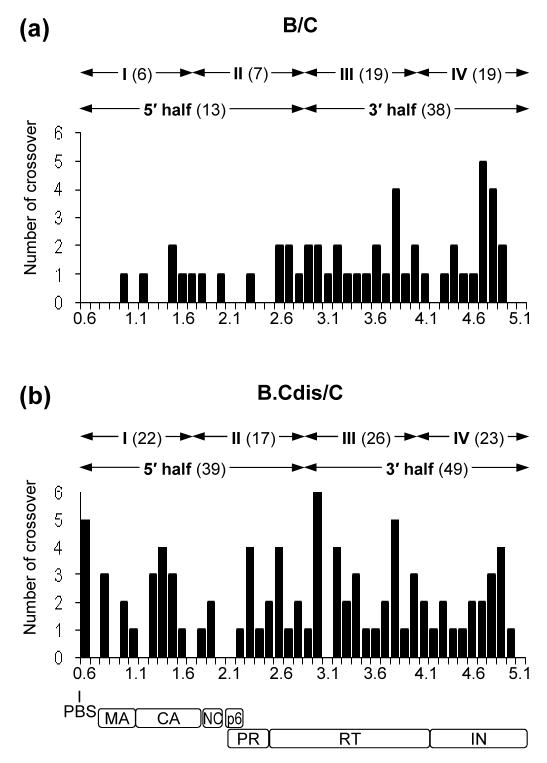
Figure 3.
Distribution of crossover junctions between the PBS to the end of pol in HIV-1 intersubtype recombinants. (a) Analysis of the recombinants from a subtype B and a subtype C parental virus that contains different DIS sequences. (b) Analysis of the recombinants from a modified subtype B virus with subtype C DIS and a subtype C parental virus. The x axis is shown in 0.1-kb increments and numbering is based on the NL4-3 viral DNA genome. The approximate locations of the PBS and viral genes are shown at the bottom. The y axis represents the number of crossover junctions observed in the 56 proviruses of each experimental group within the 0.1-kb regions. The total numbers of crossovers in the two halves and four quarters are shown above the plot. MA, matrix; CA, capsid, NC, nucleocapsid, PR, protease.

