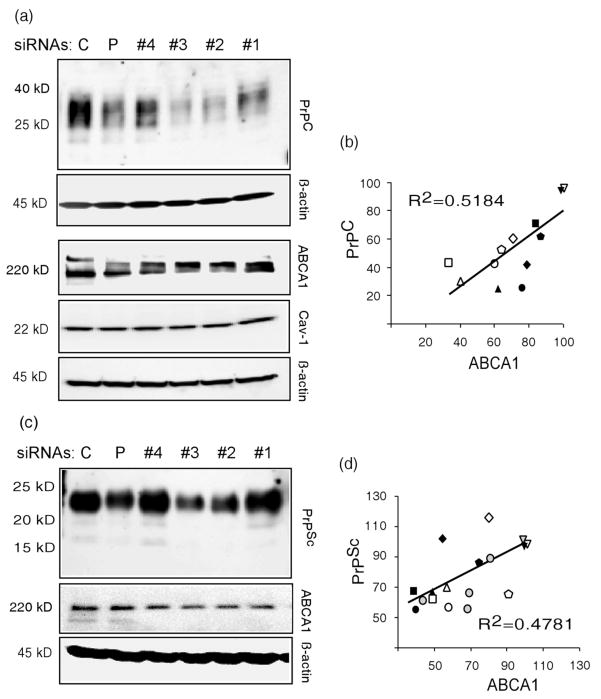
Fig. 5.
Levels of PrPC and PrPSc are reduced in proportion to ABCA1 knockdown by RNAi. (a) N2a cells were transfected with a non-specific siRNA (C), a pool of Abca1-specific siRNAs (P), or four individual siRNA probes targeting different regions in the Abca1 mRNA (#1–4, see Materials and Methods). After 72 hr, cell lysates were assayed in Western blots using anti-ABCA1, anti-Cav-1, and anti-β-actin antibodies. Immunoblots from a second experiment are shown in Supplementary Fig. S3. (b) A plot of ABCA1 concentration vs. PrPC shows a correlation of PrPC and ABCA1 concentrations (R2 = 0.5184, P = .0032). Abca1 specific siRNAs 1, 2, 3, 4, the siRNA pool, and non specific siRNA are indicated by squares, triangles, circles, diamonds, pentagons and inverted triangles. Filled and open symbols differentiate the two experiments. (c) ScN2a cells were transfected with a non-specific siRNA (C), or four siRNAs individually (#1–4) or pooled (P). Lysates were PK digested and analyzed in Western blots using anti-PrP antibody. Lysates not treated with PK were used for anti-ABCA1 and anti-β actin antibodies. A repeat of this experiment is shown in Supplementary Figure S4. Four separate cultures of ScN2a cells were treated with siRNA #3 and lysates immunoblotted with PrP, ABCA1, and β-actin; the results are shown in Supplementary Figure S5. (d) PrPSc and ABCA1 concentrations are correlated (R2 = 0.4781, P < 0.0005). Abca1 specific siRNAs 1, 2, 3, 4, the siRNA pool, and non-specific siRNA are annotated by squares, triangles, circles, diamonds, pentagons and inverted triangles. Filled, open, and shaded symbols differentiate the three sets of experiments.

