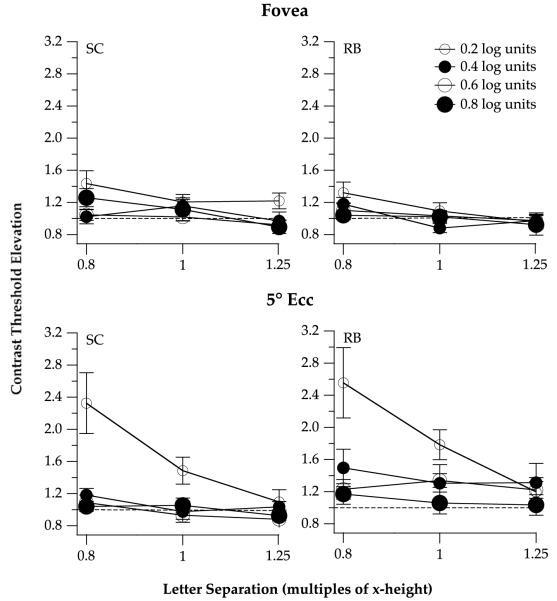
Fig. 2.
Contrast threshold elevation, ratio of the contrast threshold for identifying flanked to unflanked letters, is plotted as a function of letter separation (expressed as multiples of x-height), for the two observers. Data obtained at the fovea are given in the top panels and data obtained at 5° eccentricity are given in the bottom panels. In each panel, data are plotted for the four letter sizes (0.2–0.8 log units above acuity), coded by the size and color (white or black) of the symbols. A contrast threshold elevation of 1 (represented by the dashed line in each panel) implies a null effect of the flankers on the identification of the target letter, whereas a contrast threshold elevation greater than 1 implies crowding.

