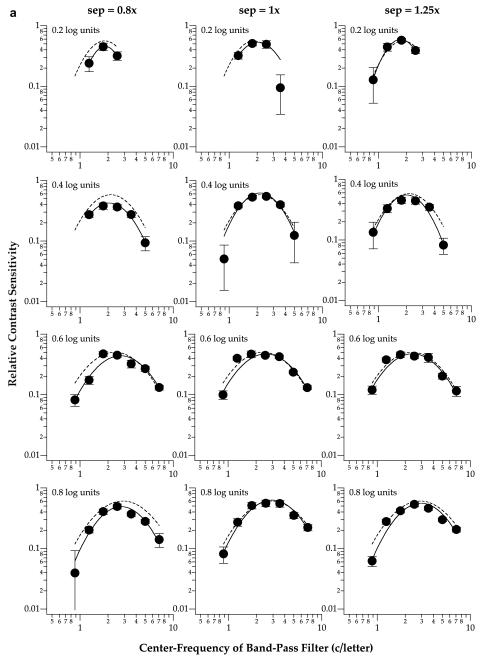
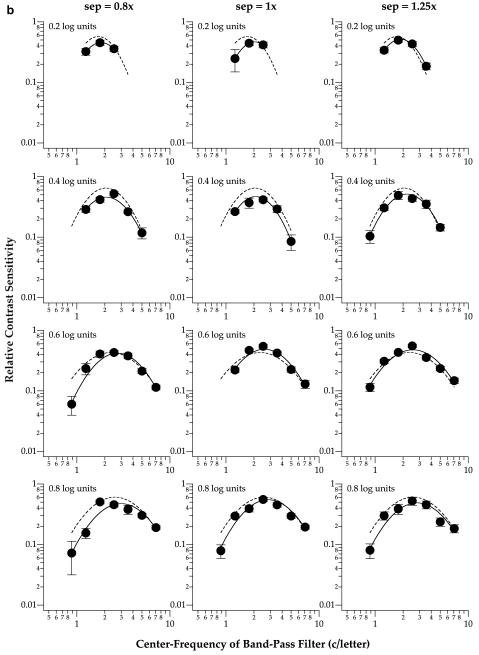
Fig. 3.
Relative contrast sensitivity for identifying the middle letter of a trigram is plotted as a function of the center frequency of the band-pass filter used to generate the letters. Data shown were obtained from observers SC (a) and RB (b), for foveal viewing. Each column of panels plots the data obtained at one letter separation. Each row of panels plots the data obtained for one letter size. The solid line in each panel represents the best-fit parabolic curve (see text for details) to the data-set. For comparison, the best-fit parabolic curve to the unflanked condition is included in each panel as the dashed line. Error bars represent ±1 SEM.


