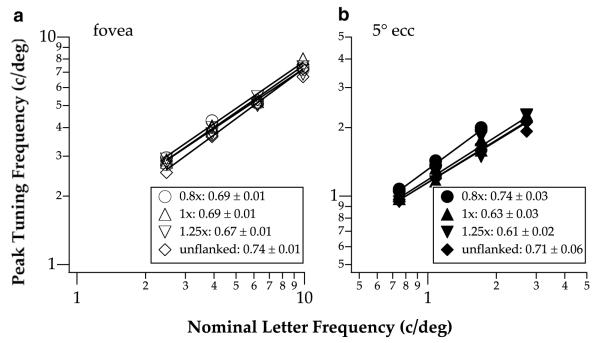
Fig. 5.
Spatial frequency corresponding to the peak of the parabolic spatial-tuning functions given in Figs. 3 and 4 is plotted as a function of letter size, expressed as nominal letter frequency in c/deg, for the different letter separations at the fovea (a) and 5° eccentricity (b). Each line represents the power function (straight line on log-log coordinates) fit to data obtained at one letter separation (including the unflanked condition) and from both observers (data from the two observers for the same condition were plotted as separate data points). Exponents of these lines are summarized in the figure legend.

