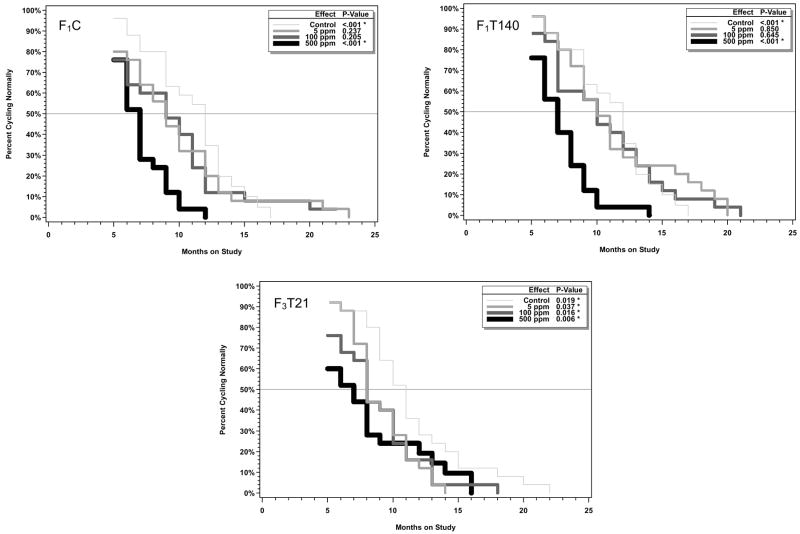
Figure 7.
Analysis of time to onset of aberrant cycles in aging females in the three arms of the chronic toxicity study of genistein. Starting at 5 months, vaginal smears were taken for 5 consecutive days each month. Animals that did not show normal cycles for two consecutive months were considered to be showing aberrant cycles and were no longer sampled. Kaplan-Meier curves are shown. The inset shows the overall p value (Wald chi-square test) as well as comparisons of each exposed group curve to the control group curve.

