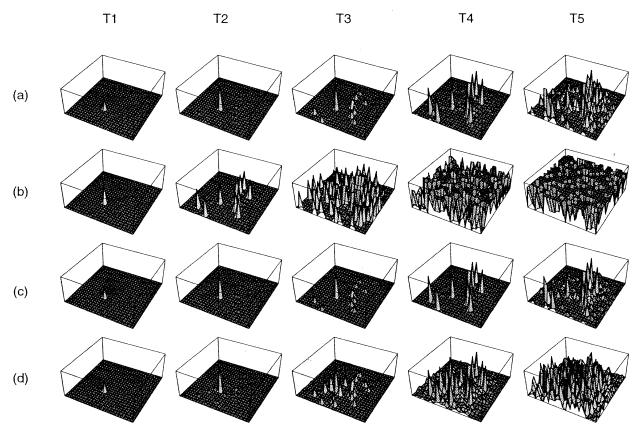
Figure 1.
PrPSc accumulation pattern over time. (a) α = 200 and no inhibition for K = 4. (b) Effect of increased PrPc production, α = 250 (no inhibition, K = 4). (c) Effect of axonal inhibition as PrPSc is accumulated (α = 250, K = 4). (d) Effect of higher local connectivity, K = 8 (α = 250, no inhibition). In all cases six long-range axons have randomly been placed between cells in addition to the K local connection per neuron.

