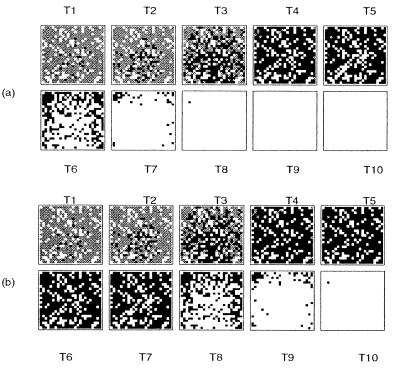
Figure 3.
Neurotoxicity of PrPSc (a) vs. loss of function through PrPc depletion (b) as triggers for neuronal loss. The distribution of uninfected cells (gray), infected (black), and absence of neurons (white) for the two possible simple mechanisms are shown at 10 equidistant time intervals until all cells are dead. The arbitrary threshold was set such that the cell dies when c(PrPSc) > 1.5 × c0(PrPc) (a) and c(PrPc) < 0.5 × c0(PrPc) (b), respectively.

