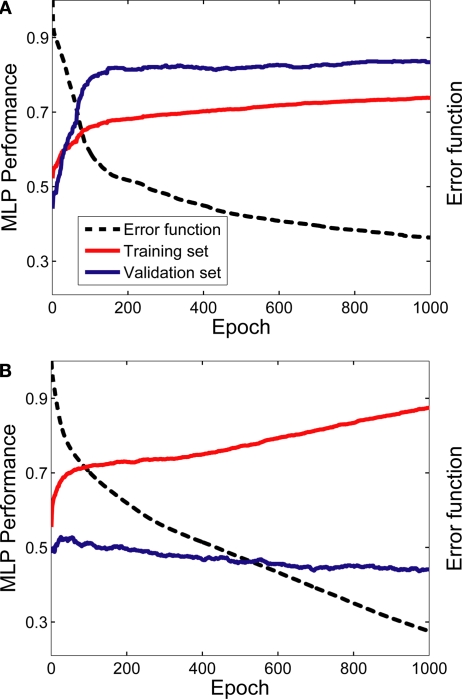
Figure 4.
Learning examples from two neurons. Panel (A) was generated from the neuron whose activity most reliably reflected the monkey's decisions (in terms of the MLP's performance on the validation dataset); whereas the data in panel (B) were generated from the neuron whose activity least reliably reflected the monkey's decisions. The graphs in both panels show the average training (red data) and validation (blue data) history; these average values were calculated from the 50 individual training histories that were generated from each of the 50 MLPs constructed for each neuron. The error function (dotted black line) is also shown as a function of training epoch; the error function is where T is the theoretical value [0 or 1] and O is the actual value, which is a continuous function, of the output node i for each spike train j. The error function is calculated as a function of each training epoch.

