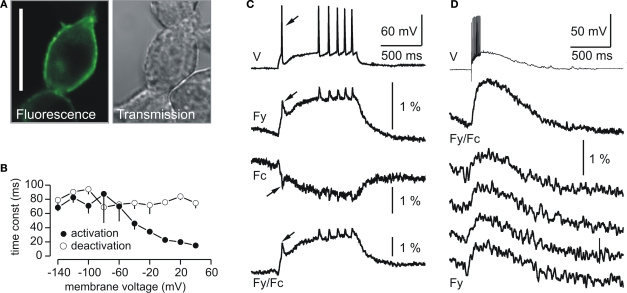
Figure 1.
Plasma membrane expression and fluorescence response properties of VSFP2.1. (A) Confocal fluorescence and transmission images of PC12 cells transfected with VSFP2.1. Note the targeting of VSFP2.1 to the plasma membrane. Scale bar is 25 μm. (B) Voltage dependence of apparent activation and deactivation time constants of VSFP2.1 fluorescence signals in PC12 cells at 35°C. (C,D) VSFP2.1 fluorescence responses to physiological neuronal membrane signals. VSFP2.1-expressing PC12 cells were voltage-clamped with membrane voltage traces recorded from olfactory mitral cells that were stimulated to generate a series of action potentials by direct current injection (C) or by electrical stimulation of the olfactory nerve (D). Traces in (C) and upper trace in (D) are the average of 50 and 90 sweeps, respectively. The lower four traces in (D) are single sweeps. Traces show membrane potential (V), yellow fluorescence (Fy), cyan fluorescence (Fc) and the ratio of yellow and cyan fluorescence (Fy/Fc). Fluorescence signals were digitally low pass filtered (0.2 kHz) and were not corrected for photobleaching. Recordings were done at 35°C (from Dimitrov et al., 2007).

