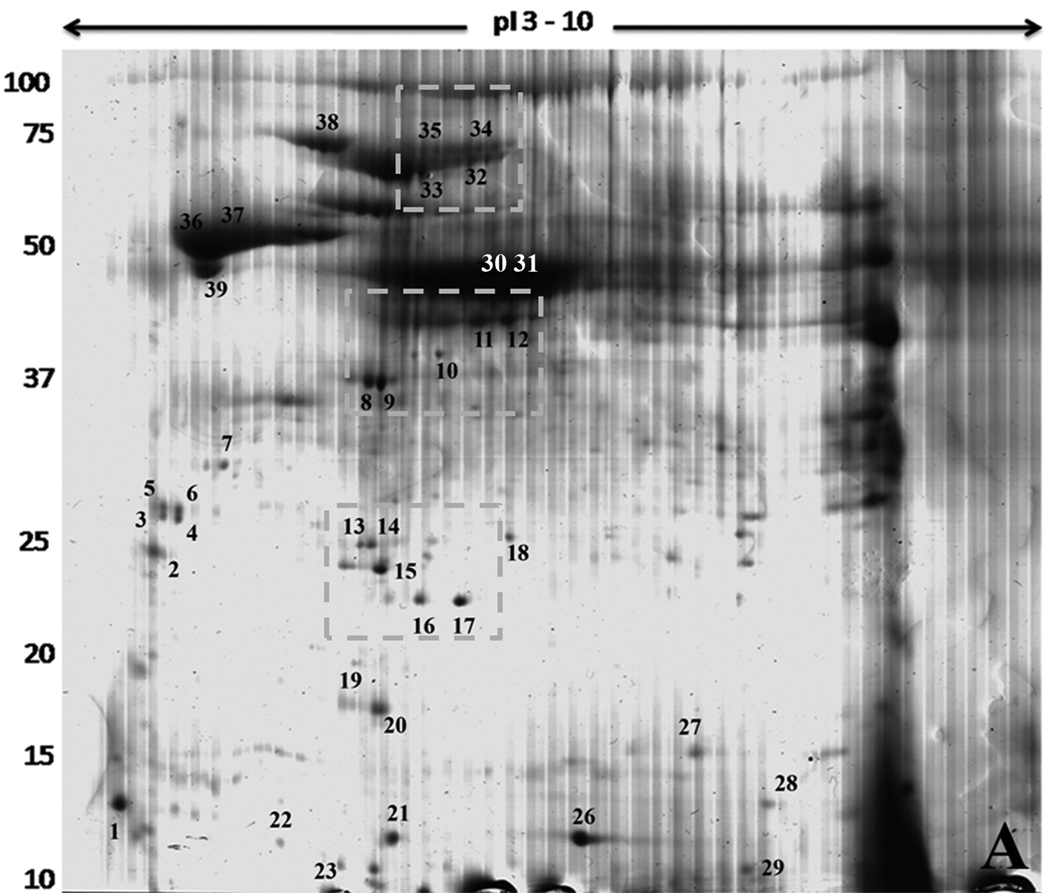
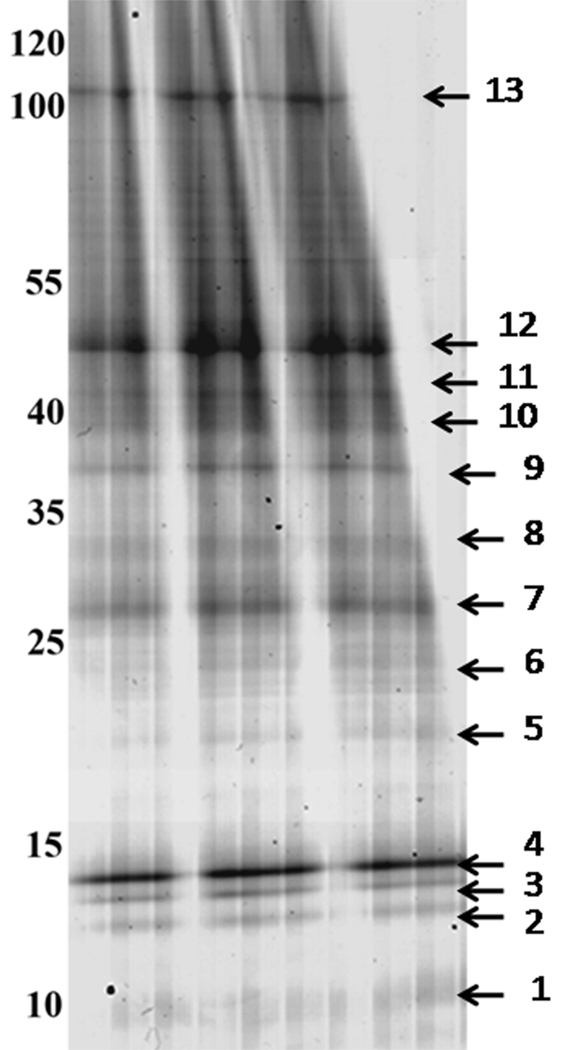
Figure 1.
Two Dimensional Gel Electrophoresis of T. cruzi proteins. The sample was electrophoresed on strips from pH 3 to 10 in the first dimension. Molecular weight markers are shown on the left and expressed in kDa. The gel was stained with Colloidal Coomassie Blue. Spots excised for mass spectrometry are numbered and located close to the respective spot. Dotted squares show the isoforms regions discussed in the text.


