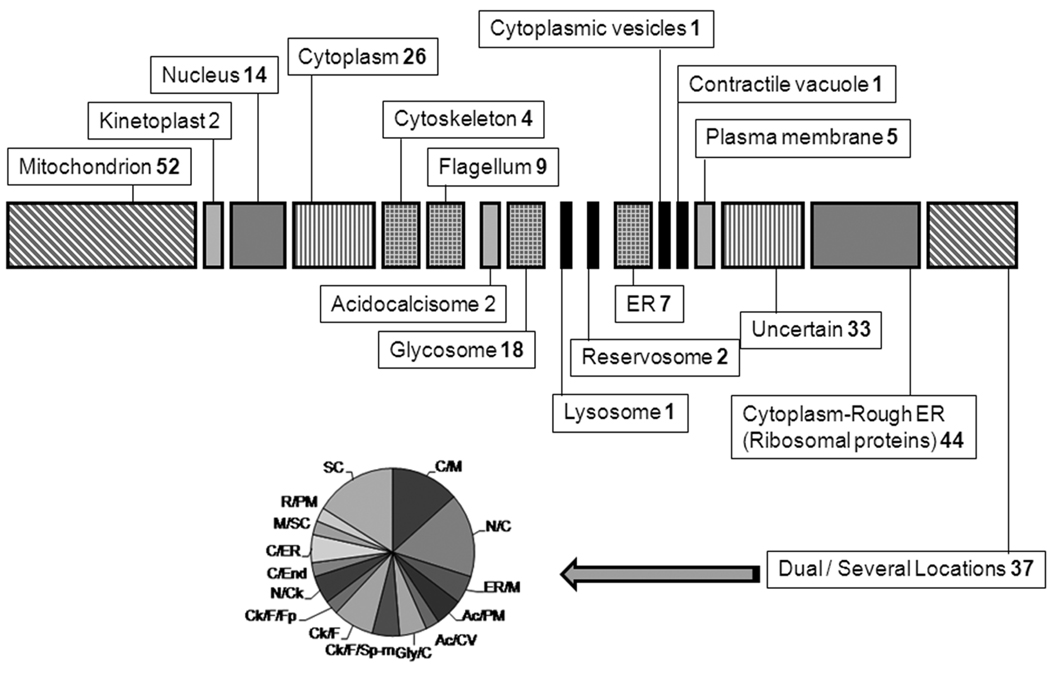
Figure 3.
A. Functional Classification of Proteins. The chart shows the different metabolic pathways or groups to which the 258 identified proteins with known or predicted function can be assigned. Numbers represent the number of proteins for each group. Hypothetical proteins are not represented here. B. Sub-cellular Distribution of Identified Proteins. The drawing shows the distribution to different cell compartments of the same set of proteins from A. Numbers indicate the proteins to that particular location. For the dual localization proteins a sub-graph indicates the distribution. SC: several compartments; C/M: cytoplasm/mitochondrion; N/C: nucleus/cytoplasm; ER/M: endoplasmic reticulum/mitochondria; Ac/PM: acidocalcisoma/plasma membrane; Ac/CV: acidocalcisome/contractile vacuole; Glyc/C: glycosome/cytoplasm; Ck/F/Sp-m: cytoskeleton/flagellum/sub-pellicular microtubules; Ck/F: cytoskeleton/flagellum; Ck/F/Fp: cytoskeleton/flagellum/flagellar pocket; N/Ck: nucleus/cytoskeleton; C/End: cytoplasm/endosomes; C/ER: cytoplasm/rough ER; M/SC: mitochondrion/several other compartments and R/PM: reservosome/plasma membrane.

