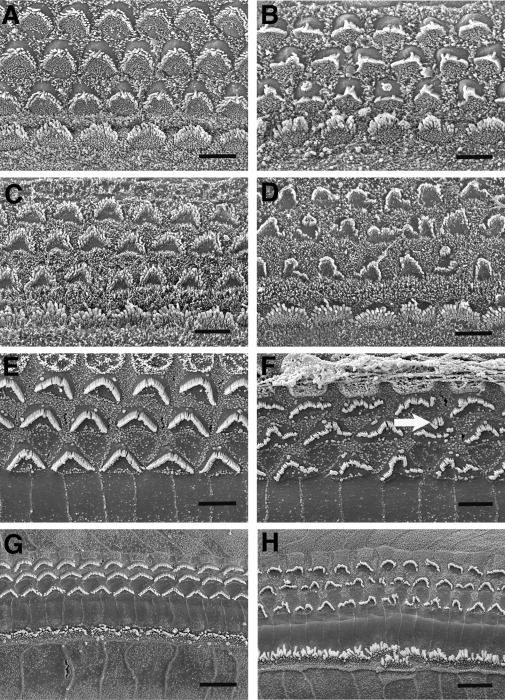
Figure 7.
Scanning electron micrographs showing surface views of the organ of Corti in Clrn1+/+ and Clrn1−/− mice aged P2 through P15. Relative to Clrn+/+ (shown in left column) the OHCs from the Clrn1−/− animals (right column) show abnormally arranged stereocilia. (A and B) P2; (C and D) P6; (E and F) P10; (G and H) P15. All micrographs taken from basal cochlear turn, expect (G and H) which show mid-basal and lower apical turns, respectively. The arrow in (F) indicates a circular cluster of stereocilia (a feature occasionally seen on OHC in the mutants). Scale bars in (A–F) indicate 5 µm; scales bars in (G) and (H) indicate 10 µm.

