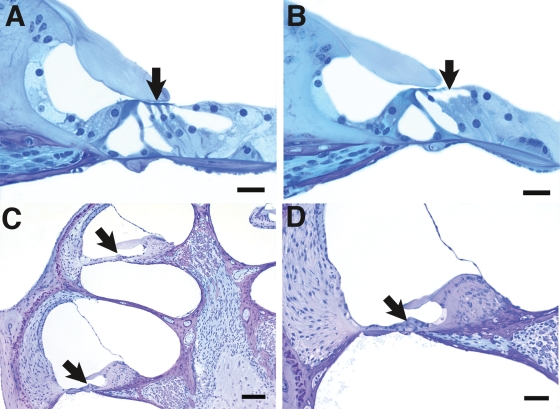
Figure 8.
Light micrographs showing cochlear cross sections from animals at P21 (A and B) and P30 (C and D). The P21 wild-type specimen (A) shows three rows of OHCs (arrow); however, in the mutant (B), the second and third row OHCs are missing (area indicated by arrow). At P30 all cochlear structures appear normal with the exception of the organ of Corti (arrows in C), which is undergoing degeneration in both the apical and basal turns. (D) Higher power view from the basal turn area at lower left in (A) demonstrating degeneration and collapse of the organ of Corti (arrow). Scales bars in (A and B) indicate 20 µm bars in (C and D) indicate 50 µm.

